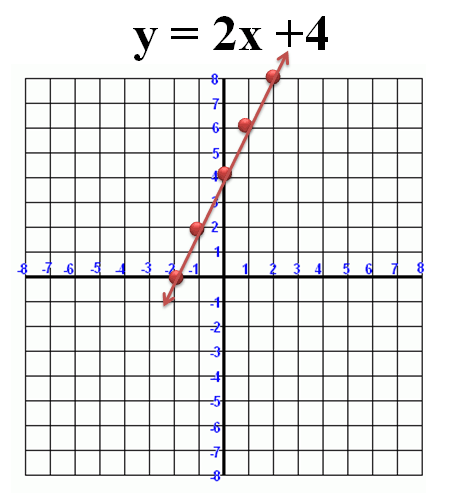
Remember that Linear Equations can be graphed on a coordinate plane.
Below is an example of a linear equation that has been graphed:
|
Figure 1. |
|---|
| Slope |
|---|
|
Slope describes how steep a line is. 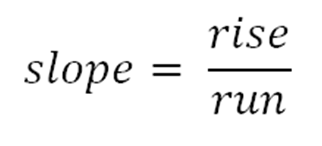
Rise = Vertical Change Run = Horizontal Change |
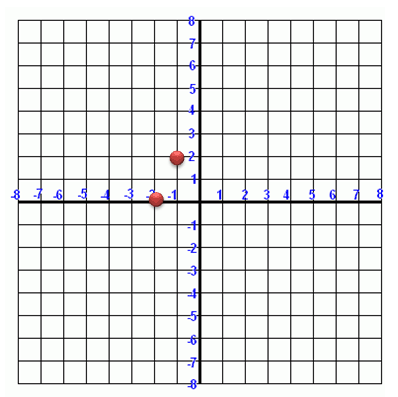
To calculate slope, start by selecting two points on your graph. Here, we've selected (-2, 0) and (-1, 2).
|
Figure 2. |
|---|
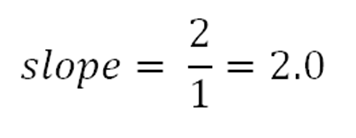
Here, our vertical change from point one to point two is positive 2, while our horizontal change is positive 1. Thus, we calculate our slope:
|
Figure 3. |
|---|


 Facebook
 YouTube


 Home
Home
 Calculators
 Tutoring