| Scatter Plots |
|---|
|
Scatter plots are a method of graphically displaying bivariate data. |
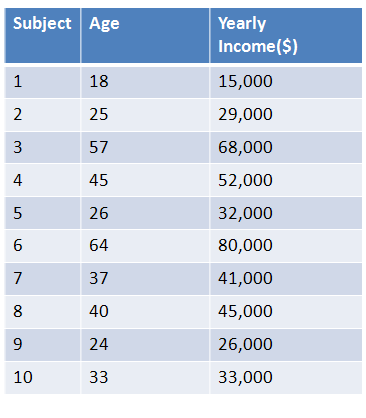
Example bivariate data is displayed below. Our two variables are age and yearly income.

|
Figure 1. |
|---|
What is the relationship between age and yearly income?
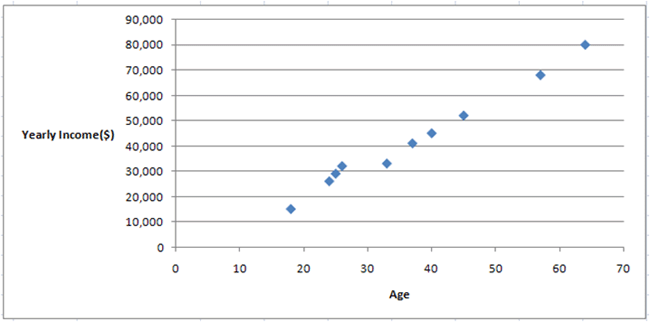
The relationship can be plotted on a scatter plot. Below, age is on the x-axis, while yearly income is on the y-axis:

|
Figure 2. |
|---|
Just by looking at the graph, it would appear that as age inceases, yearly income increases. It is a fairly good bet that our variables are related.