Just like with other tests such as the z-test or ANOVA, we can conduct hypothesis testing using Pearson’s r.
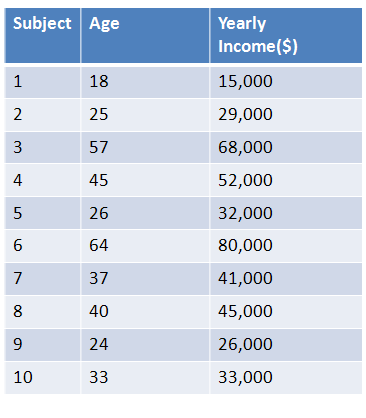
To test if age and income are related, researchers collected the ages and yearly incomes of 10 individuals, shown below. Using alpha = 0.05, are they related?

|
Figure 1. |
|---|
| Steps for Hypothesis Testing with Pearson's r |
|---|
|
1. Define Null and Alternative Hypotheses 2. State Alpha 3. Calculate Degrees of Freedom 4. State Decision Rule 5. Calculate Test Statistic 6. State Results 7. State Conclusion |
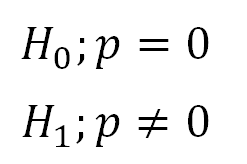
1. Define Null and Alternative Hypotheses

|
Figure 2. |
|---|
2. State Alpha
alpha = 0.05
3. Calculate Degrees of Freedom
Where n is the number of subjects you have:
df = n - 2 = 10 – 2 = 8
4. State Decision Rule
Using our alpha level and degrees of freedom, we look up a critical value in the r-Table. We find a critical r of 0.632.
If r is greater than 0.632, reject the null hypothesis.
5. Calculate Test Statistic
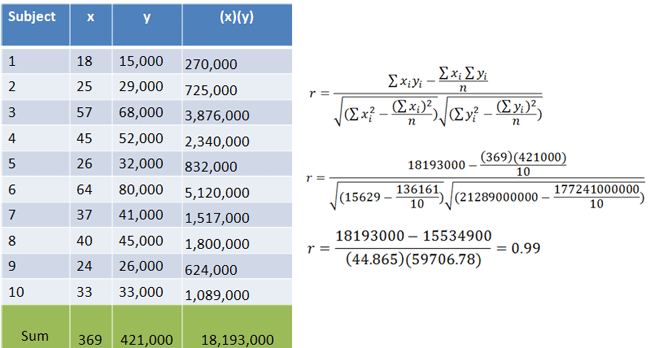
We calculate r using the same method as we did in the previous lecture:

|
Figure 3. |
|---|
6. State Results
r = 0.99
Reject the null hypothesis.
7. State Conclusion
There is a relationship between age and yearly income, r(8) = 0.99, p < 0.05