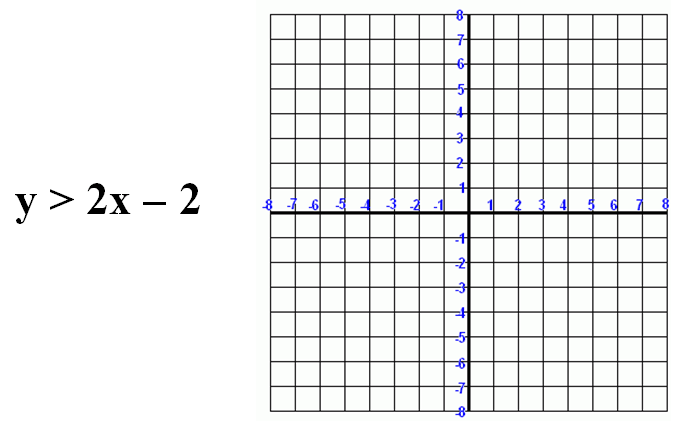
Inequalities can be graphed in the same way as regular equations.
|
Figure 1. |
|---|
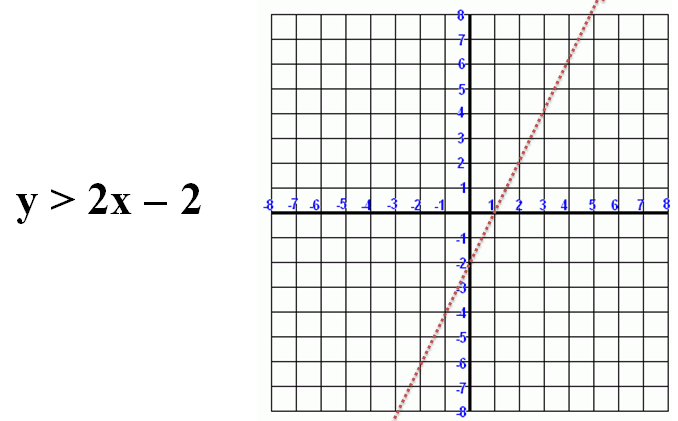
Let's try graphing the above inequality. Start by graphing the line as if it is a normal equation:
|
Figure 2. |
|---|
Here, we've used a dotted line. A dotted line is plotted when dealing with either the Greater Than (">") or Less Than ("<") symbol. A normal line is plotted when dealing with either the Greater Than or Equal to (">") or Less Than or Equal to ("<") symbol.
|
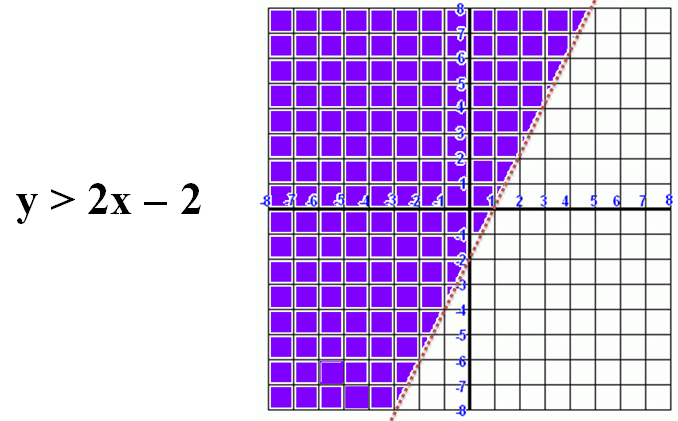
Figure 3. |
|---|
To finish, we shade the area above the dotted line. Any ordered pair (x and y coordinates) within the purple area is a valid solution to our inequality.


 Facebook
 YouTube


 Home
Home
 Calculators
 Tutoring