| Point Estimate |
|---|
|
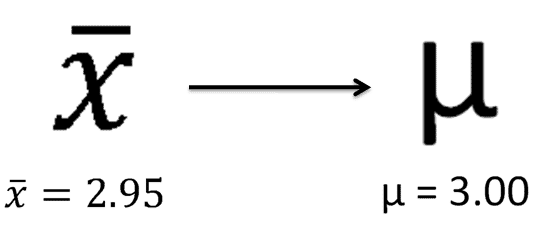
Any statistic that estimates the value of a parameter is called a point estimate. |

|
Figure 1. |
|---|
We rarely know if our point estimate is correct because it is merely an estimation of the actual value. Because of this discrepancy, we construct confidence intervals to help estimate what the actual value of the unknown population mean is.

|
Figure 2. |
|---|
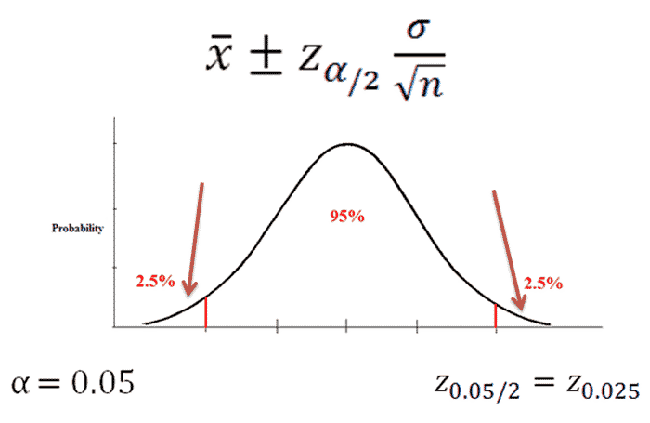
Confidence intervals are a point estimate plus/minus a margin of error. The margin of error is determined by several factors:
1. How confident we want to be with our assessment
2. Population standard deviation
3. How large our sample size is

|
Figure 3. |
|---|
Let's say we want to create a 95% confidence interval. That means we have an alpha of 0.05(5%) which is split into two equal tails. This 2.5% refers to the value we look up in the z-table in order to find the z-score we need to plug into the equation.
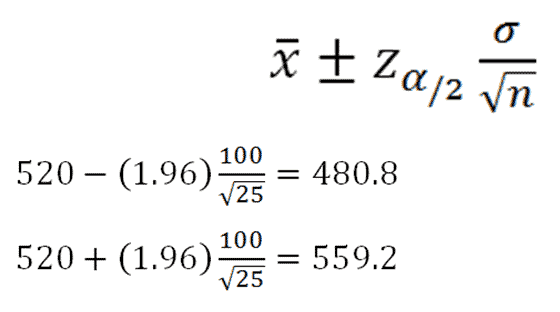
Let's try an example: On the verbal section of the SAT, the standard deviation is known to be 100. A sample of 25 test-takers has a mean of 520. Construct a 95% confidence interval about the mean.

|
Figure 4. |
|---|
We take this information and plug it into the equation for the confidence interval. Because we're creating a 95% confidence interval, this means we have two tails of 2.5%. When we look up 0.025 in the Z table (click to open), we find that it corresponds to a z-score of 1.96. After plugging everything into the equation, we find a lower bound of 480.8 and an upper bound of 559.2. We are 95% confident that the mean SAT score is between 480.8 and 559.2.