| Central Tendency |
|---|
|
Central tendency refers to the measure used to determine the center of a distribution of data. It is used to find a single score that is most representative of an entire data set. |
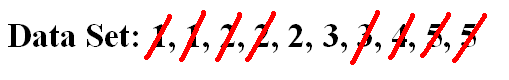
1, 1, 2, 2, 2, 3, 3, 4, 5, 5
If we could pick a single value to represent the above sample data set, what ways could we do it?
| Mean |
|---|
|
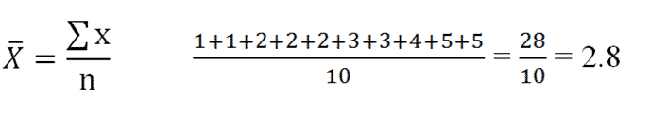
To find the mean, add up all values, then divide by the total number of values you have. |
|
Figure 1. |
|---|
Our mean is 2.8.
| Median |
|---|
|
To find the median, first put all the values in order (this has been done already). Next, find out what value lies in the middle. |
|
Figure 2. |
|---|
What happens when there are two values in the middle? Find the median by calculating the mean of the two values. Here, the median is (2 + 3) / 2 = 2.5
| Mode |
|---|
|
The mode is simply the most frequently occurring value. |
For our data set, 2 is the mode because it occurs the most frequently.
If two values occur the most often, the distribution is said to be bi-modal. If more than two values occur the most often, the distribution is said to be multi-modal.
What should you use?
The mean will be used for almost all occasions. However, outliers can sometimes interfere with usage of the mean.
| Outlier |
|---|
|
An outlier is a value that is very different from the other data in your data set. This can skew your results. |
In situations with many outliers, the mean is not a good measure of central tendency. The median or mode should be used instead, depending on the type of information you’re dealing with.


 Facebook
 YouTube


 Home
Home
 Calculators
 Tutoring